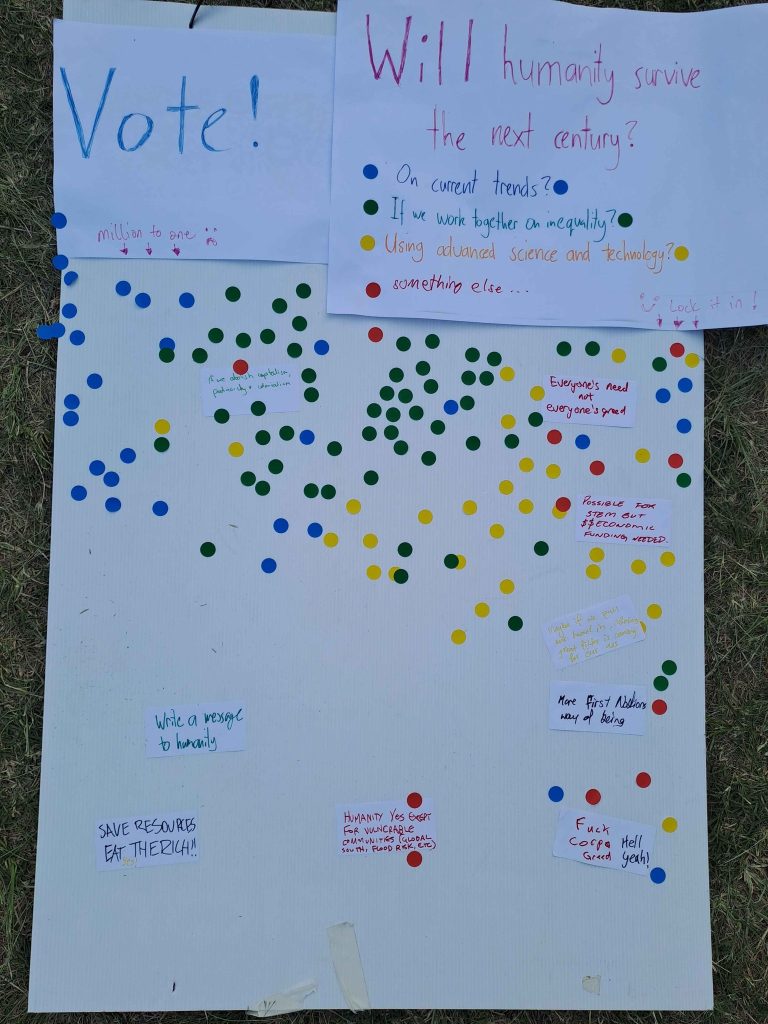
For Brisbane Pride 2024, I helped co-organise a stall with Fusion Party Australia. As part of the stall we had a dot vote tally running with the question: “Will humanity survive the next century?” Passers-by were invited to place one of four coloured stickers on the board, with each colour representing a different approach. Leftmost side of the board was labelled “million to one :(” and rightmost side of the board was labelled “Lock it in!”. The four colours/approaches were: Red (“On current trends”), Green (“If we work together on inequality”), Yellow (“Using advanced science and technology”), Red (“Something else…”).
This approach combined to give some sweet multidimensional data, and by the end of the day we had 131 dots on the board across the four colours. Later the next week, I wrote a Python script using OpenCV (source) to do separate and map the coloured dots, then construct a quantitative data set which I ran some basic analysis on. The results were as follows:
- Blue dots: 31, median value: 17% standard deviation: 32%
- Green dots: 58, median value: 54% standard deviation: 19%
- Red dots: 12, median value: 81% standard deviation: 21%
- Yellow dots: 30, median value: 71% standard deviation: 19%
Commits: 9. Lines of code: ????